
来源:机器之心
本文约2700字,建议阅读5分钟
pandas是数据科学家必备的数据处理库,我们今天总结了10个在实际应用中肯定会用到的技巧。
1、Select from table where f1=’a’ and f2=’b’
使用AND或OR选择子集:
dfb = df.loc[(df.Week == week) (df.Day == day)]OR的话是这样 dfb = df.loc[(df.Week == week)|(df.Day == day)]
2、Select where in
从一个df中选择一个包含在另外一个df的数据,例如下面的sql
select * from table1 where field1 in (select field1 from table2)
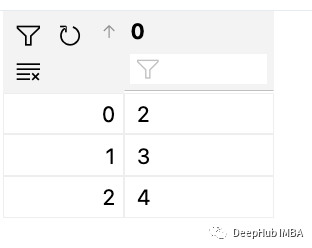
我们有一个名为“days”的df,它包含以下值。
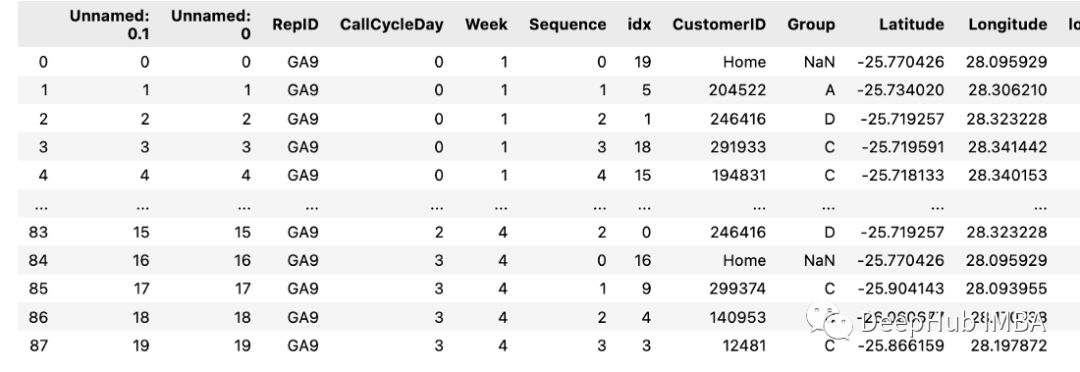
如果有第二个df:
可以直接用下面的方式获取
days = [0,1,2] df[df(days)]
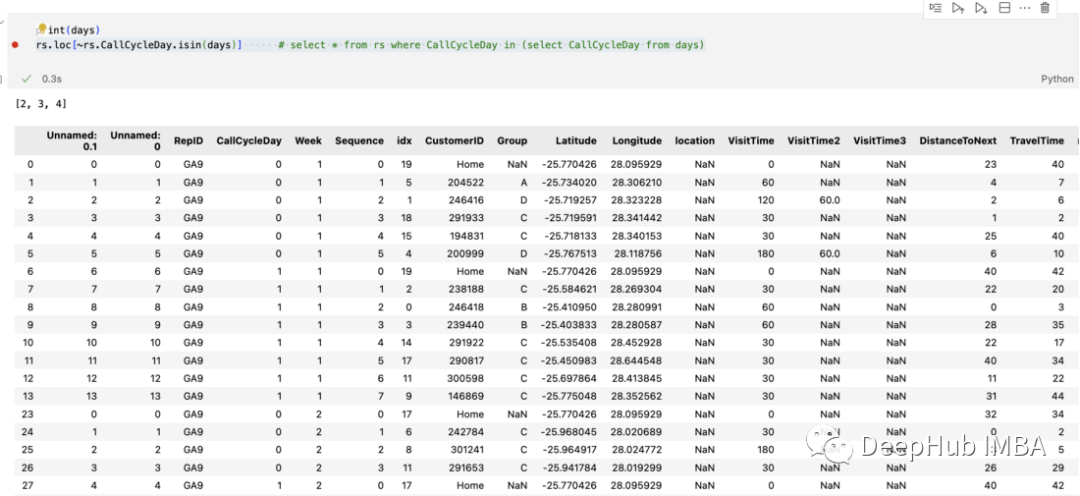
3、Select where not in
就像IN一样,我们肯定也要选择NOT IN,这个可能是更加常用的一个需求,但是却很少有文章提到,还是使用上面的数据:
days = [0,1,2] df[~df(days)]
使用~操作符就可以了
分组统计和求和也是常见的操作,但是使用起来并不简单:
df(by=['RepID','Week','CallCycleDay']).sum()
如果想保存结果或稍后使用它们并引用这些字段,请添加 as_index=False
df.groupby(by=['RepID','Week','CallCycleDay'], as_index=False).sum()
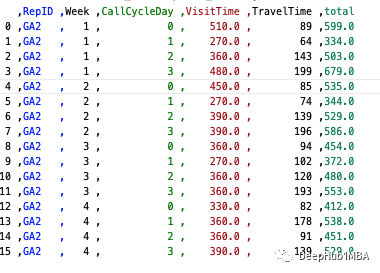
使用as_index= false,可以表的形式保存列
5、从一个表更另外一个表的字段我们从一个df中更改了一些值,现在想要更新另外一个df,这个操作就很有用。
dfb = dfa[dfa.field1='somevalue'].copy() dfb['field2'] = 'somevalue' dfa.update(dfb)
这里的更新是通过索引匹配的。
6、使用apply/lambda创建新字段我们创建了一个名为address的新字段,它是几个字段进行拼接的。
dfa['address'] = dfa.apply(lambda row: row['StreetName'] + ', ' + row['Suburb'] + ', ' + str(row['PostalCode']),axis=1)
7、插入新行
插入新数据的最佳方法是使用concat。我们可以用有pd. datafframe .from_records一将新行转换为df。
newRow = row.copy() newRow.CustomerID = str(newRow.CustomerID)+'-'+str(x) newRow.duplicate = True df = pd.concat([df,pd.DataFrame.from_records([newRow])])
8、更改列的类型
可以使用astype函数将其快速更改列的数据类型
df = pd.read_excel(customers_.xlsx') df['Longitude'] = df['Longitude'].astype(str) df['Latitude'] = df['Longitude'].astype(str)
9、删除列
使用drop可以删除列:
def cleanColumns(df): for col in df.columns: if col[0:7] == "Unnamed": df.drop(col, inplace=True, axis=1) return df
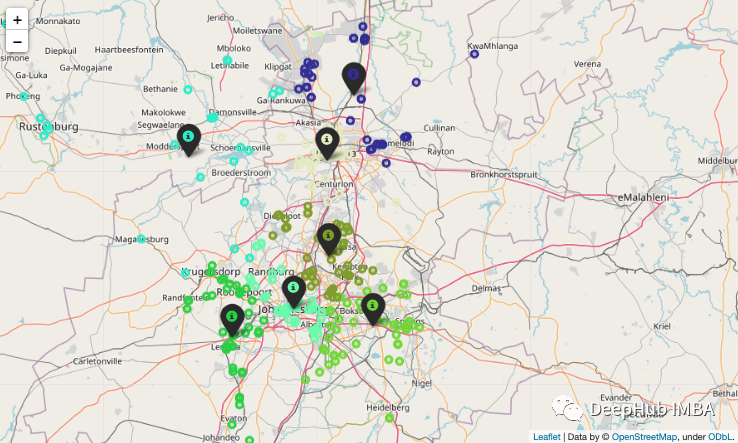
10、地图上标注点
这个可能是最没用的技巧,但是他很好玩
这里我们有一些经纬度的数据:
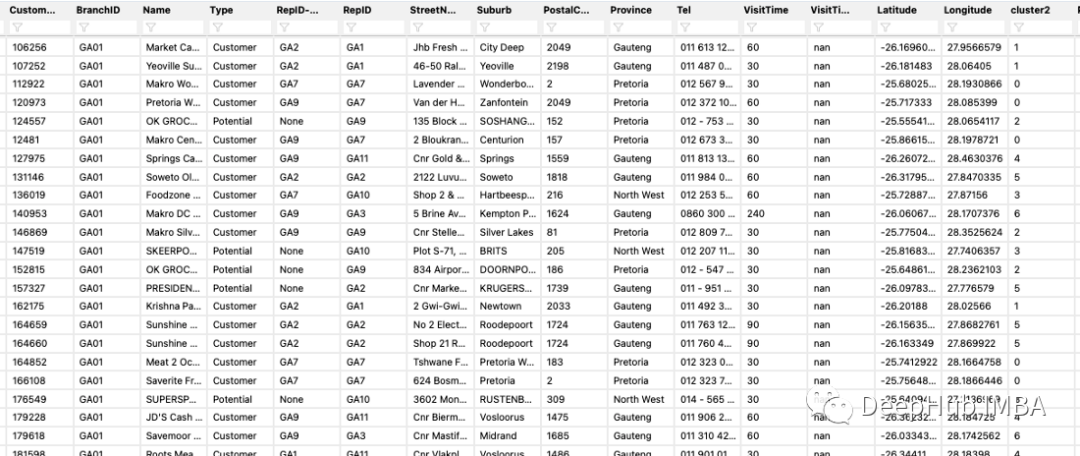
现在我们把它根据经纬度在地图上进行标注:
df_clustercentroids = pd.read_csv(centroidFile) lst_elements = sorted(list(dfm.cluster2.unique())) lst_colors = ['#%06X' % np.random.randint(0, 0xFFFFFF) for i in range(len(lst_elements))] dfm["color"] = dfm["cluster2"] dfm["color"] = dfm["color"].apply(lambda x:lst_colors[lst_elements.index(x)]) m = folium.Map(location=[dfm.iloc[0].Latitude,dfm.iloc[0].Longitude], zoom_start = 9) for index, row in dfm.iterrows(): folium.CircleMarker(location=[float(row['Latitude']), float(row['Longitude'])],radius=4,popup=str(row['RepID']) + '|' +str(row.CustomerID),color=row['color'],fill=True,fill_color=row['color'] ).add_to(m) for index, row in df_clustercentroids.iterrows(): folium.Marker(location=[float(row['Latitude']), float(row['Longitude'])],popup=str(index) + '|#=' + str(dfm.loc[dfm.cluster2==index].groupby(['cluster2'])['CustomerID'].count().iloc[0]),icon=folium.Icon(color='black',icon_color=lst_colors[index]),tooltip=str(index) + '|#=' + str(dfm.loc[dfm.cluster2==index].groupby(['cluster2'])['CustomerID'].count().iloc[0])).add_to(m) m
结果如下:
编辑:王菁
| 留言与评论(共有 0 条评论) “” |